


Public finances and public spending
Public finances and public spending
In the aftermath of the financial crisis, government spending as a share of national income reached a peak not seen since the mid-seventies – mainly because the cash spending plans set out prior to the crisis were largely kept to despite being predicated on growth that did not materialise in the end.
A decade of austerity later, spending has been brought back to pre-crisis levels. Public sector receipts have been much more stable than spending but have increased slowly and today stand at their highest share since the mid-eighties.
The gap between spending and revenues is the deficit. As spending has been brought down and revenues have slowly grown, this gap has started to close, but has not disappeared entirely. If on the other hand, we focus just on current or day-to-day spending and ignore investment spending, then there was a small surplus in the last financial year. For the first time in seventeen years, the UK government has not borrowed to finance its day-to-day spending.
However, the headline deficit – including borrowing to fund investment – is not particularly low by historical standards: At 1.9% of national income in the last financial year, it stands exactly at its long-run average between the Second World War and the onset of the financial crisis. In addition, the large deficits run during the Great Recession have left a mark of the stock of debt owed by the UK public sector, which more than doubled as a share of national income since 2007 and has only recently, and very gradually, begun to fall, remaining at 81.7%.
Despite this doubling of debt, record low interest rates have caused the cost of servicing the UK debt to fall, rather than rise over the same period. Spending on debt interest currently stands at 1.8% of national income, or £37.5 billion in nominal terms, compared to 2.0% of national income in 2007–08.
Figure 1. Tax and spend over the last two decades
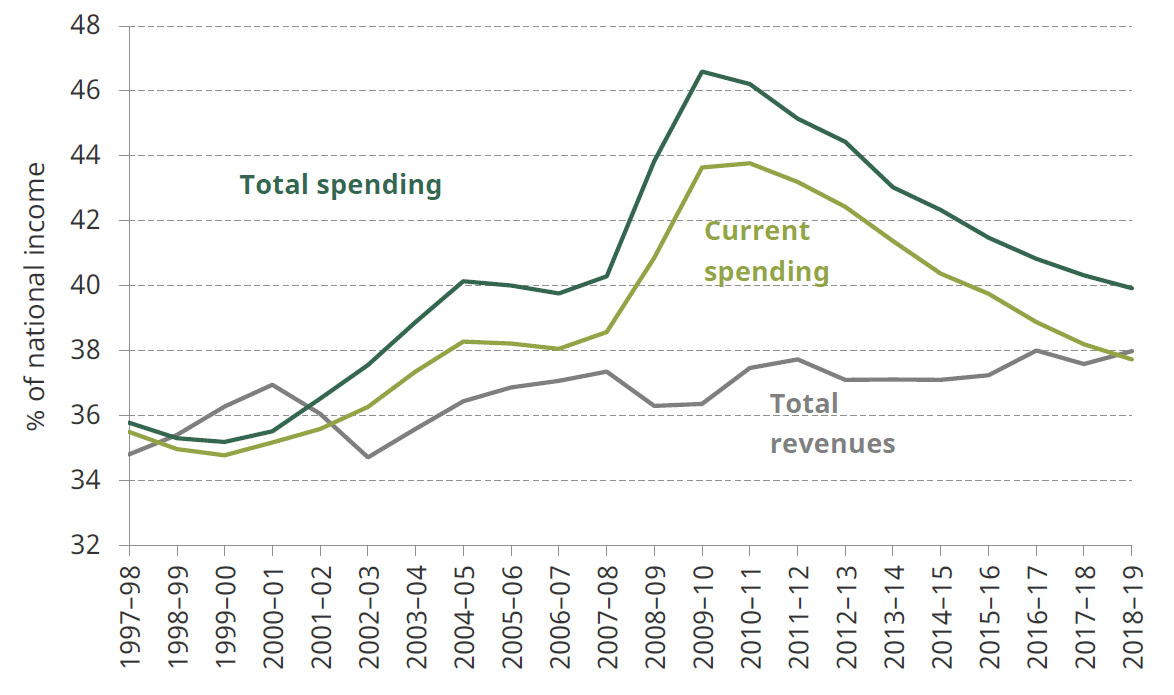
Source: Office for Budget Responsibility, ‘Public finances databank’, 05 November 2019, https://obr.uk/data/
Useful resources
Election 2019 analysis
What do the election manifestos mean for local government funding?
Local government funding is rarely a major battleground in election campaigns. This ‘rule’ appears to be holding in the current campaign, despite evident pressures in areas like adults’ and children’s social care services, following a decade of cuts to councils’ funding.
Tax and spending since the crisis: is austerity over?
In the aftermath of the global financial crisis and associated recession, government borrowing soared to more than 10% of national income. Borrowing has since been reduced through a combination of net tax rises, cuts to the generosity of the working-age social security system and cuts to public service spending.
Background analysis
Report
English local government funding: trends and challenges in 2019 and beyond
Observation
Budget or no budget, with borrowing now on the rise again fiscal realities can’t just be wished away
Book chapter
Fiscal targets and policy: which way next?
Public finances: where are we now?
Spending round 2019: keeping perspective
Data
Long-run public spending series
Social media
The Liberal Democrats follow Labour and the Conservatives in promising big boosts to investment spending.
— IFS (@TheIFS) November 20, 2019
But they are now the only major party committed to reducing the national debt as a fraction of GDP.
New #GE2019 analysis funded by @nuffieldfound: https://t.co/qsixMbmqRZ pic.twitter.com/u7k5FObtRq
The government spends £190 billion a year employing around 5.3 million people.
— IFS (@TheIFS) November 19, 2019
This accounts for 22% of total public spending, and is a major part of what the government does.
New #GE2019 analysis, funded by @nuffieldfound: https://t.co/sMVdKz1lKa pic.twitter.com/jTTYof4Zlz
.@johnmcdonnellMP has suggested that student debt could be cancelled under Labour. Writing off tuition debt since 2012 would cost around £20bn, all student debt around £70bn. More #GE19 IFS analysis here https://t.co/8Jmliz4hSM pic.twitter.com/P8QrwpJ30k
— IFS (@TheIFS) November 19, 2019
The size of the state is broadly unchanged since before the crisis - but spending continues to be increasingly allocated to providing healthcare and state pensions.
— IFS (@TheIFS) November 17, 2019
Here's the latest IFS #GE2019 analysis, funded by @NuffieldFound https://t.co/av1Cuhg4ym pic.twitter.com/bLCRAiOrhU
Official estimates suggest that GDP per person is 20% lower now than it would have been had it grown by 2.3% per year since 2008 (its long-run trend rate).
— IFS (@TheIFS) November 17, 2019
See the full IFS #GE2019 report on tax & spending since the financial crisis here: https://t.co/av1Cuhg4ym pic.twitter.com/Byu3JrwPW5
Both the Conservatives and Labour are proposing substantial increases in government investment spending at the start of #Election2019 campaigning.
— IFS (@TheIFS) November 7, 2019
Public investment at 3% of GDP – the Conservatives’ proposed cap – would reach a level not sustained in the last 40 years. pic.twitter.com/CfJDzJhVL2
The Conservatives and Labour have both announced new fiscal targets while launching their #GeneralElection2019 campaigns.
— IFS (@TheIFS) November 10, 2019
Will these prove more durable than the unlucky 13 we've had in the last decade? pic.twitter.com/vH8qqNcl0x
The Chancellor and the Shadow Chancellor propose a fiscal rule that requires revenues to cover day-to-day spending, although on slightly different time horizons.
— IFS (@TheIFS) November 10, 2019
Last year was the first time in seventeen years that a UK government ran a (very small) current budget surplus. pic.twitter.com/KIHnr76fDv
Labour plans to spend an extra £55 billion per year on investment over the next five years.
— IFS (@TheIFS) November 7, 2019
If delivered, this would more than double public investment spending, to a level unprecedented since the 1970s - a very different era. pic.twitter.com/7bDXdyrG1x
Labour’s #Election2019 plans would take UK government investment spending from near the bottom of the international league table to near the top.