


Total spending on schools in England is about £44 billion in 2019–20. This includes all day-to-day spending by schools and local authorities on pupils aged 5 to 16, spending on pupils with special educational needs and disabilities, the pupil premium and other smaller grants. Our recent annual report on education spending showed how spending per pupil grew substantially over the 2000s, before falling in real-terms since 2009–10.
Between 1999–2000 and 2009–10, spending per pupil in schools grew by over 5% per year after accounting for inflation.
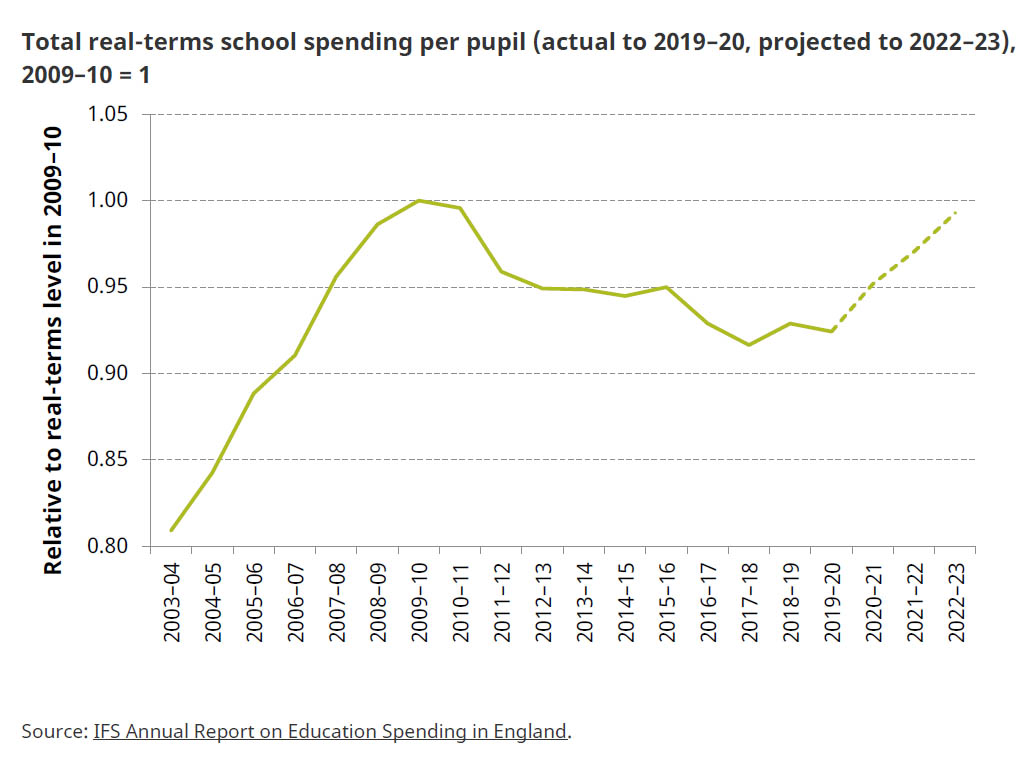
Compared to other government departments, the schools budget has been relatively protected since 2009–10. Even so, in the decade between 2009–10 and 2019–20, spending per pupil fell by 8% after accounting for inflation. This represents the largest cut to spending per pupil since at least the 1970s.
In the 2019 Spending Round, the government committed to increase school spending by £4.3 billion (in today’s prices) by 2022, with the first part of the money delivered next year. This would near enough reverse the cuts to school spending per pupil seen over the last decade.
Still, even if this funding is delivered in full, it would leave spending per pupil about the same level in 2022 as it was 13 years earlier in 2009. This represents a substantial squeeze on school resources as compared with recent history. The previous lowest growth over a 13-year period was an 18% increase between 1987 and 2000.
There also remain significant pressures on school resources, particularly in terms of support for pupils with special educational needs and disabilities. Funding for pupils with high needs is due to grow by £700m or 10% in real-terms in 2020. However, the number of pupils with high needs has risen by almost 100,000 since 2016 or about 10% per year.
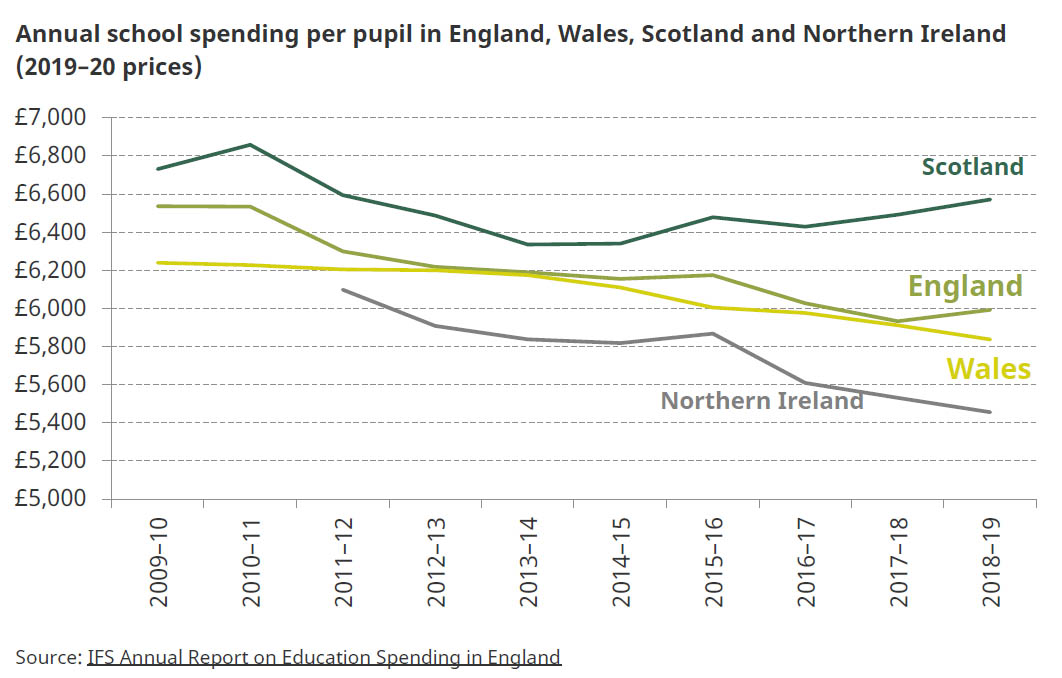
Wales, Scotland and Northern Ireland make their own decisions on school spending. Since 2009–10, cuts have been largest in Northern Ireland (11%), with cuts of 8% in England and 6% in Wales. Cuts have been smallest in Scotland, where spending fell 2% over this period. Scotland also had the highest spending per pupil in 2018–19 (£6,600), followed by England (£6,000), Wales (£5,800) and Northern Ireland (£5,500).
Total real-terms school spending per pupil (actual to 2019–20, projected to 2022–23), 2009–10 = 1
Annual school spending per pupil in England, Wales, Scotland and Northern Ireland (2019–20 prices)
Background analysis
Report 2019 annual report on education spending in England
Social media
With today’s conservative manifesto, we now have a full picture of the main parties’ plans for school spending in England in #GE2019 @TheIFS pic.twitter.com/6FWdl6S1FT
— Luke Sibieta (@lukesibieta) November 24, 2019