


Whether the UK leaves the European Union, and if so on what terms, is a crucial issue and therefore rightly should be the subject of much debate in the run-up to the general election on 12 December. But Brexit is not the only economically important decision that the UK faces. So the general election debate should not be only about Brexit.
With this in mind, this report sets out one page on each of the following six economic areas where attention, and action, by policymakers are needed. Serious parties seeking election should be setting out how they would seek to address these serious challenges.
- productivity performance and average earnings
- living standards of different generations
- in-work poverty
- pressures on pensions, health and social care spending
- weaknesses in the tax system
- getting to net zero greenhouse gas emissions
Abysmal productivity and earnings growth since 2008
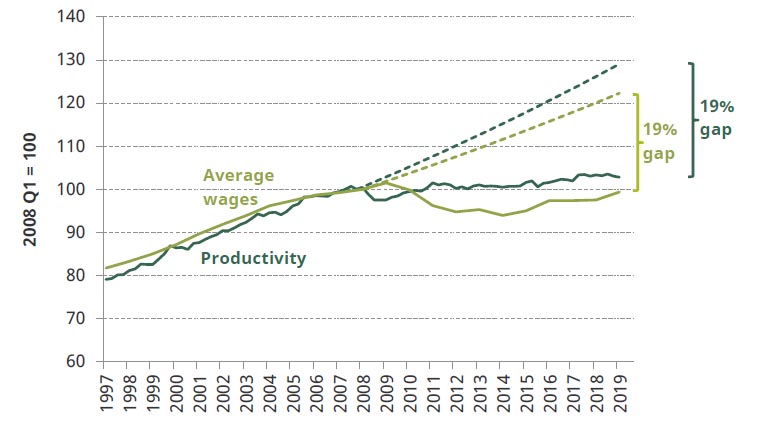
Productivity growth in the UK since the 2008 financial crisis has been unprecedentedly poor. Figure 1 shows that, over the last 11 years, productivity – as measured by output per hour worked – has grown by just 2.9%. That is about as much as it grew on average every 15 months in the preceding 40 years. As a result, productivity in the UK is now 19% lower than it would have been had the pre-crisis trend (measured over the period back to 1971) continued. This is shown in Figure 1.
This really matters. In the long run, average living standards will grow in line with productivity growth.
Figure 1 also shows how average wages – measured here as real median hourly wages – have performed since 1997. Between 1997 and 2008, these grew each year, with average growth of 1.8% per year. As a result, average wages in April 2008 were £13.35 per hour. They then fell over the subsequent six years. While wages have since grown, by April 2019 they were still only at £13.27 per hour – i.e. still no higher than their April 2008 level. Had they grown in line with the pre-crisis trend, average earnings would instead be £16.33 an hour; so, like productivity, they are 19% lower than they otherwise might have been. For someone working a 35-hour week, that is a difference of more than £5,000 a year.
While the hourly wages of many of the lowest-paid have been boosted by the National Living Wage, weekly earnings of low-paid men have not done as well, since hours of work have fallen. In any case, increasing legislated minimum wages cannot fix the long-term problem. For that, we need a focus on the drivers of productivity, including education, skills, public infrastructure, competition, private sector investment and free trade. At least the last two of these would be more challenging to fix in a post-Brexit world.
Figure 1. Productivity and average wages have performed terribly since 2008
Note and source: See sources at the end of this page.
The living standards and prospects of younger generations
Squeezed living standards and economic opportunities have become an especially acute concern for younger generations.
Average (median) earnings of those in their 20s and 30s today are still 2% and 7% below where they were for people of that age in 2008. This stalling in earnings between generations is unprecedented.
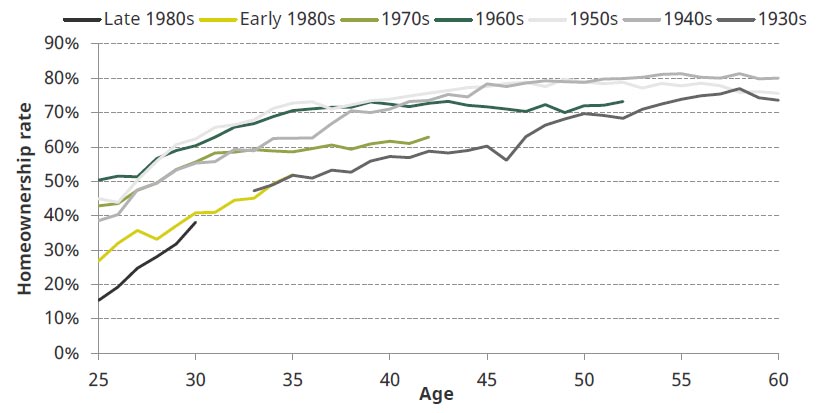
Meanwhile, young people have also been struggling to accumulate wealth at the rate that their predecessors did. The biggest contributory factor has been the collapse in homeownership. At age 30, only 38% of those born in the late 1980s were homeowners, compared with 55% or more for all generations born between the 1940s and the 1970s (see Figure 2). The higher price of homes relative to incomes faced by younger generations, particularly in Southern England, is the main explanation for this change.
Many more people in their 20s and 30s are now renting in the private market, as both homeownership and the social housing sector have been in decline. Median housing costs for those in their 20s and 30s are now about 20% higher than 20 years ago. Meanwhile, low interest rates mean that (typically older) owner-occupiers have lower housing costs than in the past.
Those low interest rates have played a key role in limiting wealth accumulation among the young. They have pushed up house prices; they are partially responsible for the demise (in the private sector) of final salary occupational pensions; and they will make it extremely hard for younger generations to catch up later on because the returns they get on saving are so low. We might have seen a long-term change in the balance of economic power, which will require a serious and thoughtful response.
Figure 2. Homeownership by age, for people born in different decades (Great Britain)
Note and source: See sources at the end of this page.
In-work poverty
The dismal performance of earnings in recent years has exacerbated a major shift in the nature of poverty and low income in the UK: away from pensioners and the unemployed, towards working households who are not earning enough to lift them above the poverty line. Any government looking to tackle poverty needs to recognise and respond to that reality.
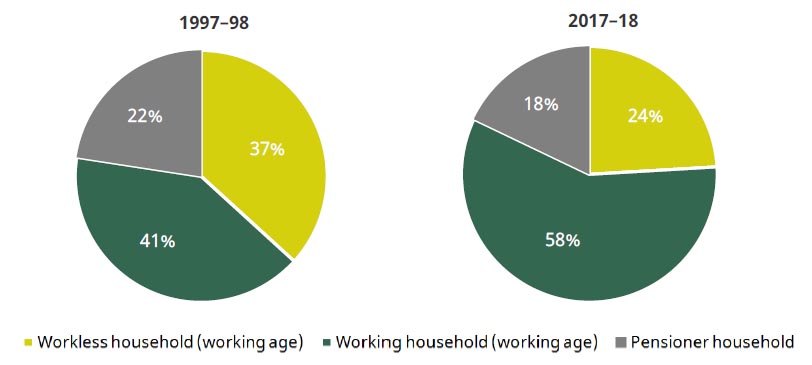
As Figure 3 shows, of all those below the official income poverty line, 58% are either in paid work or share a household with someone who is in paid work – up from 41% 20 years ago.
In part, this reflects positive trends. There are fewer workless households: 10% of working-age adults and children now live in such a household, down from 15% (i.e. a decline of one-third) compared with 20 years ago. Pensioner incomes have increased, so now only 18% of those in poverty are pensioners or live with a pensioner – down from 22% 20 years ago, despite a rise in the size of the pensioner population. Based on after-housing-costs income, pensioners are now considerably less likely to be poor than those of working age, and especially households with children.
However, it also reflects a lack of earnings growth and increases in housing costs among low-income working households (due in part to the lower rates of homeownership documented above). Since 2010–11, rises in in-work poverty have also been increased by cuts to in-work benefits.
These pressures on households on modest earnings provide the backdrop to some of the big policy changes, and policy debates, of recent years, and will continue to do so during the upcoming election campaign. Major examples include a renewed focus on increasing minimum wages (which IFS researchers will examine further later in the election campaign) and the roll-out of universal credit.
Figure 3. Breakdown of people in poverty in Great Britain, by household type
Note and source: See sources at the end of this page.
The public finance challenges of demographic change
As the population has aged, and cost pressures have increased, public spending on health and pensions has risen. Over the last 30 years, spending on these two areas has increased from 8.5% of national income to 13.1%. We are now spending £100bn more than we would have been had spending on these areas stayed the same as a fraction of our total national income. For decades, we have accommodated these increases by spending less on other things. In the long run, very big cuts in defence spending have facilitated these increases. More recently, we have had cuts across most areas of public spending.
Looking forward, these pressures will not abate. The number of people over state pension age has been kept steady over the last decade as state pension ages have risen, but will start to rise again after next year. Numbers will rise from 12m today to 13m by 2025.
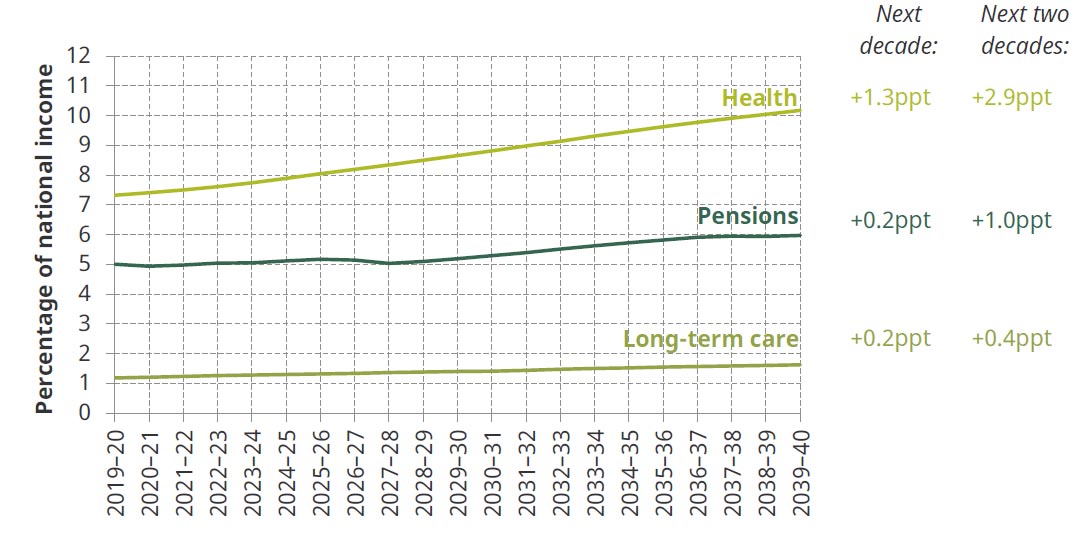
As shown in Figure 4, the latest OBR estimates are that, taken together, spending on pensions, health and social care would need to increase by 0.8% of national income (£18bn in today’s terms) over the next five years, and by 1.7% of national income (£38bn) over the next decade, to keep pace with demographic change and other cost pressures. In 20 years’ time, spending would need to be 4.3% of national income (£94bn) higher.
Increased costs on this scale will require either fundamental changes to the delivery and generosity of health, pensions and social care, and/or deep cuts in other public spending, and/or substantial tax rises. While the last 30 years have seen a response on pension policy as pension ages have been pushed up, there seems to be no recognition of the challenges posed by rising healthcare costs and no progress towards a sustainable settlement for social care. How should health be funded in a sustainable way or how should demand be restrained? How should the current complex, opaque and unfair system for social care funding be reformed? These are among the most pressing political questions facing us.
Figure 4. Projected change in public spending required to meet demographic change
Note and source: See sources at the end of this page.
Weakness in the tax system
The UK government is taking almost 35% of national income in tax – the highest sustained share since the 1940s. Given pressures from demographic change and the various spending promises being made by the main parties, it is likely that taxes will need to rise further. It is clear from what other countries do that raising more in tax is perfectly economically possible, but getting there would require some tough decisions and reforms. The parties should set out how they would pay for any additional spending, and how they would respond to threats to existing revenue streams such as:
- More and more people are working via a business they have set up rather than as employees. The much lower rates at which business income is taxed, not least because of very low rates of capital gains tax, encourage this trend and cost the exchequer well over £10bn a year.
- Fuel duties already raise £5½bn less this year as a result of the government’s failure to maintain duty rates in line with inflation for the last nine years. Going forward, rising fuel efficiency and the nascent shift to alternatively fuelled vehicles will require new ways of taxing motorists.
- It has long been hard to pin down which activities of multinationals should be taxed in the UK. The growth of digital services is making this challenge even tougher.
- We are increasingly reliant for our tax revenues on a small number of high-income individuals. The highest-income 1% of adults pay more than a third of all income tax. This makes the public finances vulnerable to changes in their incomes or behaviour.
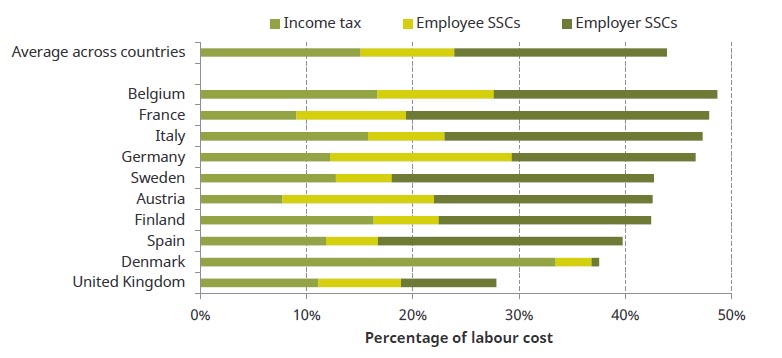
If proposing higher taxes, politicians should bear in mind that it is average earnings, rather than top earnings, that are taxed markedly less here than in many other Western European countries (see Figure 5). And the UK does not raise unusually little from corporation tax. A reliance on asking ‘the rich’ and big companies to pay more has its limits and would be far from risk-free.
Figure 5. Average income tax and SSC rates at UK median earnings (c. £28,000), 2016
Note and source: See sources at the end of this page.
Getting to net zero greenhouse gas emissions is a huge challenge
All main parties are signed up to a target to get the UK’s greenhouse gas emissions to net zero by 2050, and perhaps earlier if the rhetoric is to be believed. The case for achieving this goal is strong. Yet, while progress to date has been good – the UK’s domestic emissions are 44% down on their 1990 level – policies are not in place to come anywhere near to meeting that target. According to the Climate Change Committee, on which IFS Director Paul Johnson sits as a member, substantial change is required in the next few years, including, but by no means limited to:
- by 2025, a clear strategy for completely replacing gas as a source of domestic heating;
- by 2030, or very soon thereafter, all new car and van sales need to be electric;
- by 2030, move from 50% to 80% of electricity coming from low-carbon sources;
- by 2030, have in place the infrastructure for substantial carbon capture and storage.
Meanwhile, the real level of duty on petrol and diesel has been cut by 17% over the last decade and road transport is now the single biggest source of UK greenhouse gas emissions. We continue to subsidise households’ spending on gas and electricity through a reduced rate of VAT. There are no proposals for an economy-wide carbon tax, which should be a necessary component of any efficient programme of decarbonisation.
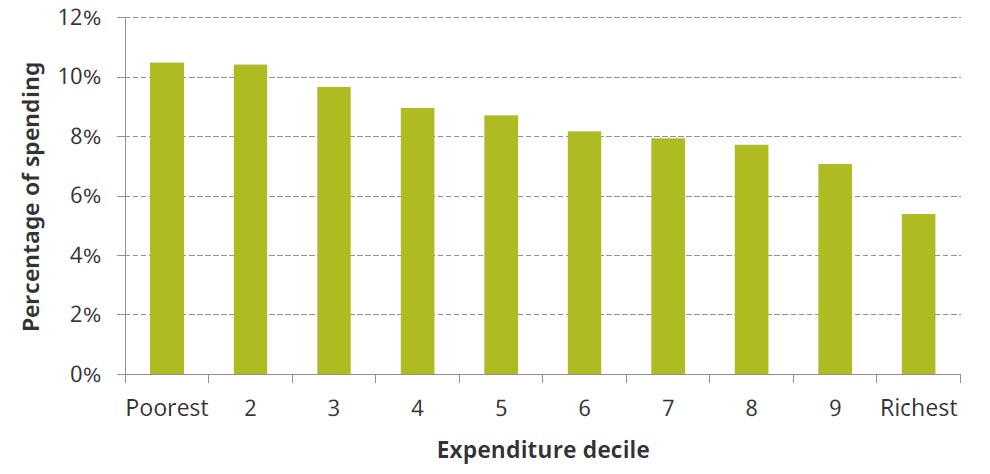
One policy problem, as illustrated in Figure 6, is that the share of household spending going on gas, electricity and petrol/diesel is larger among less well-off households. Additional taxes will require compensation packages for more vulnerable households.
Getting to net zero by 2050 is possible. But to get there would require substantial and costly action over the period of the next parliament. To get there earlier than 2050 would be much more difficult and costly. There is no value in politicians simply competing on targets. They need to spell out the policies that will actually be required to meet the targets and be clear about how the immediate costs will be met.
Figure 6. Share of household spending devoted to motoring fuel and domestic energy by expenditure decile
This report, including notes and sources, is available for download here.