


Today was the intended date of Sajid Javid’s first Budget as Chancellor. The failure to implement a Brexit deal, and the general election campaign, means that the Budget has been delayed. Much has changed since the last set of official economic and fiscal forecasts were produced by the Office for Budget Responsibility (OBR) last March. So had it not been delayed what would the fiscal backdrop to today’s Budget have been?
No doubt the chancellor would have been keen to point out that reductions to borrowing since 2009–10 have meant that in 2018–19 borrowing in cash terms was back to the level seen in 2007–08. Measured as a share of national income, borrowing in 2018–19 was 1.9%, its lowest share since 2001–02. This is about in line with the average rate of borrowing seen over the period from the end of the Second World War through to 2007–08.
Mr Javid might have been less keen to highlight the changing outlook for borrowing over the next few years. Back in March the OBR forecast that borrowing would continue to fall (albeit being some way off meeting the Government’s supposed overarching fiscal objective to eliminate the deficit by the mid-2020s). Since then, as shown in Figure 2, the outlook for borrowing has risen, driven by two factors:
- First, the Office for National Statistics have implemented significant classification and methodological changes – most notably a welcome improvement in the fiscal accounting of student loans. Tomorrow the OBR will publish an update on its estimate of these – showing how they would have affected its March forecast. Figure 1 shows the estimate we included in last month’s IFS Green Budget (including the effects of the student loan change and other changes to public pension accounting and recording of corporation tax receipts), the effect of which was to push up measured borrowing by an average of almost £20 billion a year over the next five years.
- Second, in September Mr Javid announced the outcome of his Spending Round for the coming financial year. This included a substantial £13 billion boost to the day-to-day budgets of central government spending departments, with no attempt to finance these from higher taxes or cuts elsewhere. This adds to borrowing next year. We don’t know what spending plans will be after that but even if we assume that extra money is only made available to meet commitments on health and schools then borrowing would also be higher in subsequent years.
After incorporating these (and some other, less significant) adjustments, our Green Budget forecast was for government borrowing to breach the Government’s 2% ceiling on borrowing in 2020–21, and that in 2023-24 it would be at 1.9% of national income – the same rate as in 2018–19. If correct, this would mean the end of the era of deficit reduction, with the UK running a deficit around its historical average.
If the Bank of England reduces its growth forecasts in its inaugural Monetary Policy Report to be published tomorrow then our public finance forecasts will of course change and we will update in the light of new information.
Figure 1. The deficit has fallen since 2009-10
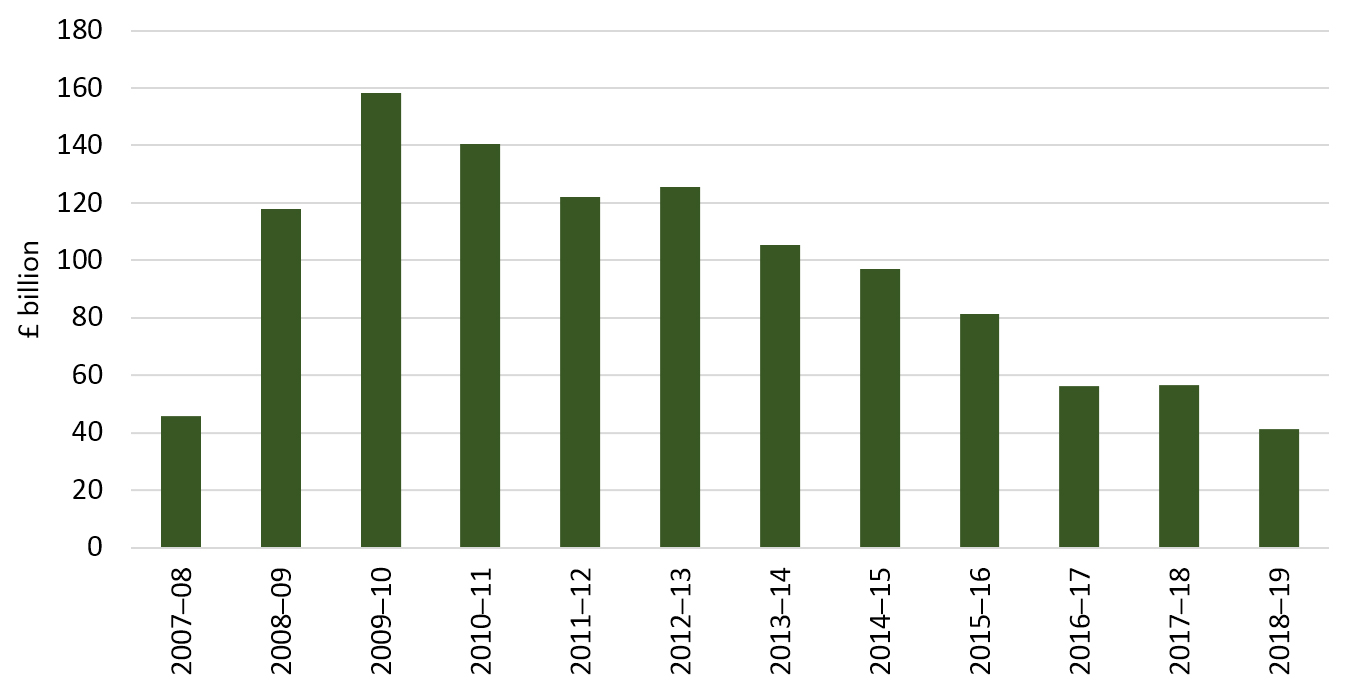
Source: Outturn data from OBR ‘Public finances databank’, September 2019 (https://obr.uk/data/).
Figure 2. The era of deficit reduction appears to be at an end
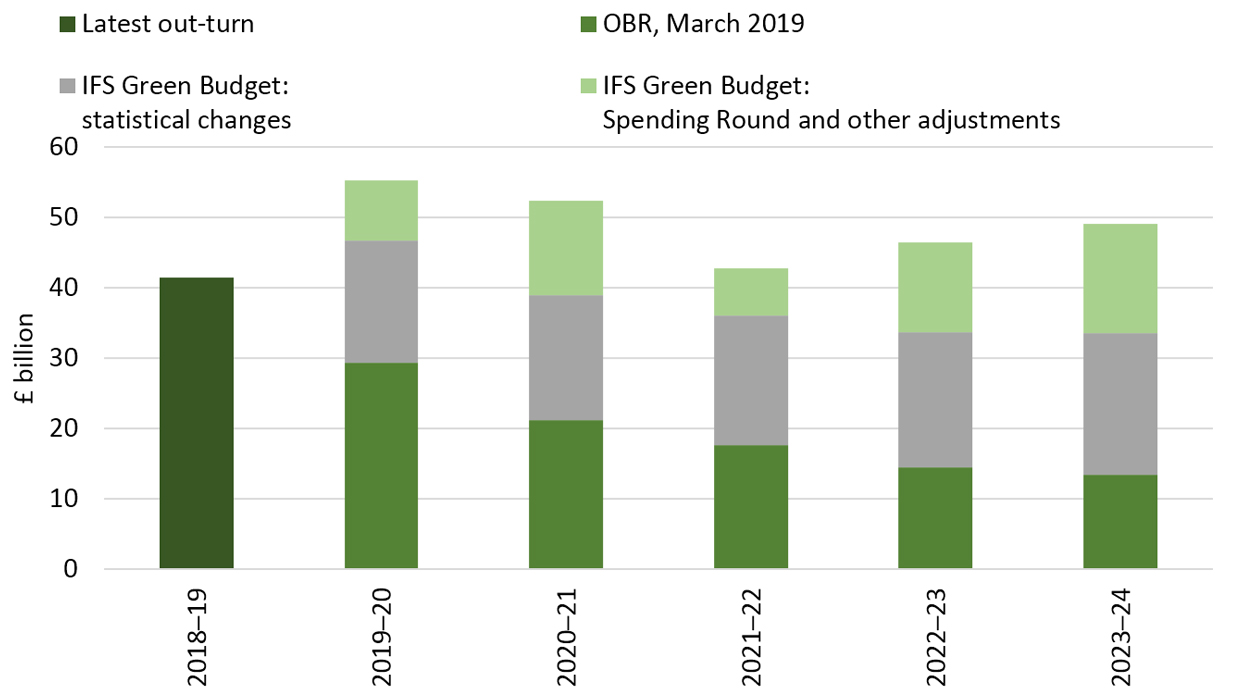
Source: Outturn data from OBR ‘Public finances databank’, September 2019 (https://obr.uk/data/). Forecasts from Tables 4.1 and 4.2 of Emmerson, C. and Stockton, I. ‘Public finances: where are we now?’ in C. Emmerson, C. Farquharson and P. Johnson (eds), The IFS Green Budget: October 2019. London: Institute for Fiscal Studies.
The planned increases in day-to-day spending on public services next year are large, and come on top of increases in spending this year. But, as shown in Figure 2, even if delivered in full these spending increases would still leave spending in 2020–21 3% lower in real-terms than was the case in 2010–11, representing a truly remarkable period for spending on public services.
Different spending areas have experienced very different spending paths over this period. The Department for Health and Social Care will have seen its day-to-day spending budget rise by almost a quarter in real-terms. Spending on education has followed overall spending. In contrast spending in many other areas has been subject to deep cuts. For example, the day-to-day spending budget of the Ministry of Justice in 2020–21 is a remarkable 23% lower than what was spent in 2010–11.
Figure 3. A remarkable decade of cuts to the day-to-day spending budgets of many departments
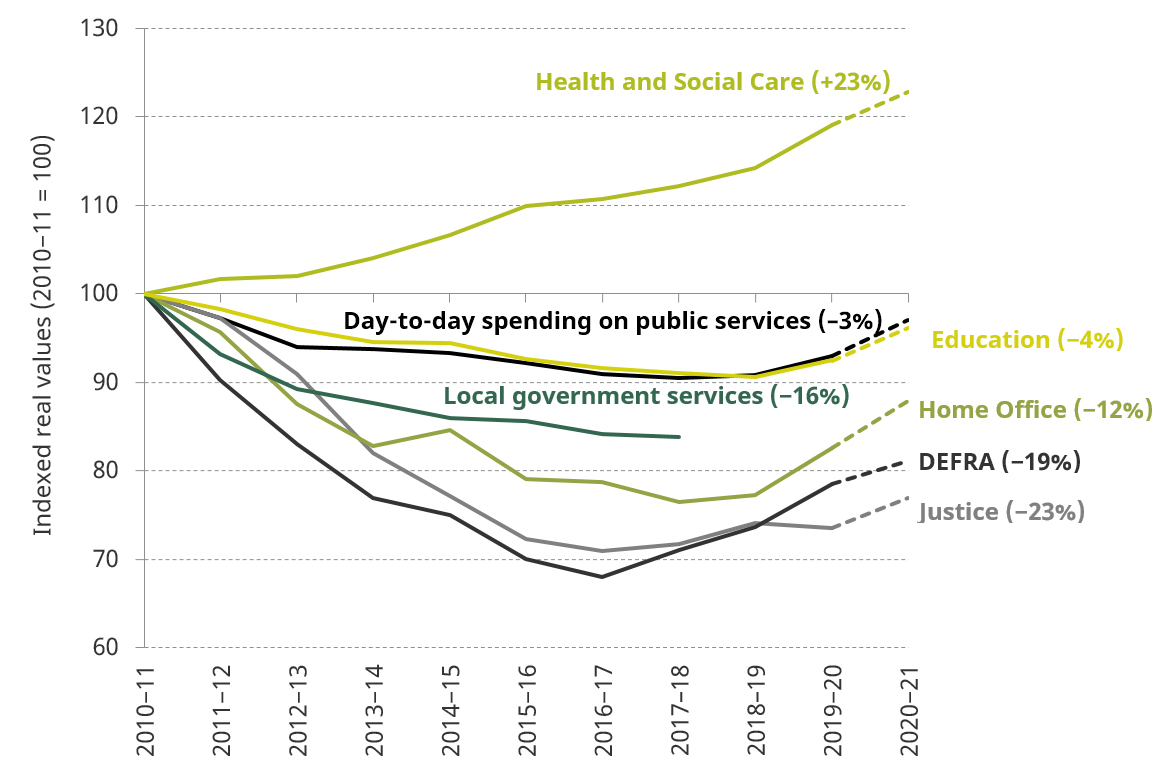
Source: Figures 6.3 and 6.4 of Crawford, R. and Zaranko, B. ‘Spending Round 2019: keeping perspective’ in C. Emmerson, C. Farquharson and P. Johnson (eds), The IFS Green Budget: October 2019. London: Institute for Fiscal Studies.
The large boost to day-to-day spending now planned for 2020–21 suggests there will be pressure for further increases in subsequent years. The Spending Round increases were financed through increased borrowing rather than tax rises. Might there be scope to continue further down this path?
Figure 3 shows how the substantial borrowing over the last decade has pushed up public sector net debt. Whereas it was running below 40% of national income debt is now (after stripping out the balance sheet of the Bank of England, which temporarily increases headline debt due to the liabilities incurred to finance the Term Funding Scheme) is running at close to 75% of national income. Moreover, the October 2019 IFS Green Budget forecasts were for very little decline in public sector net debt as a share of national income over the next five years.
What this means, especially given the sensitivity of this pattern to changes in the level and profile of growth, is that there is very little scope for both offering net giveaways and being on course to have debt lower at the end of the next parliament than it is today. In other words, promises of significant tax cuts or spending increases are likely to lead not just to higher borrowing but to higher debt.
Figure 4. The rise and slight fall of public sector debt since 2007–08
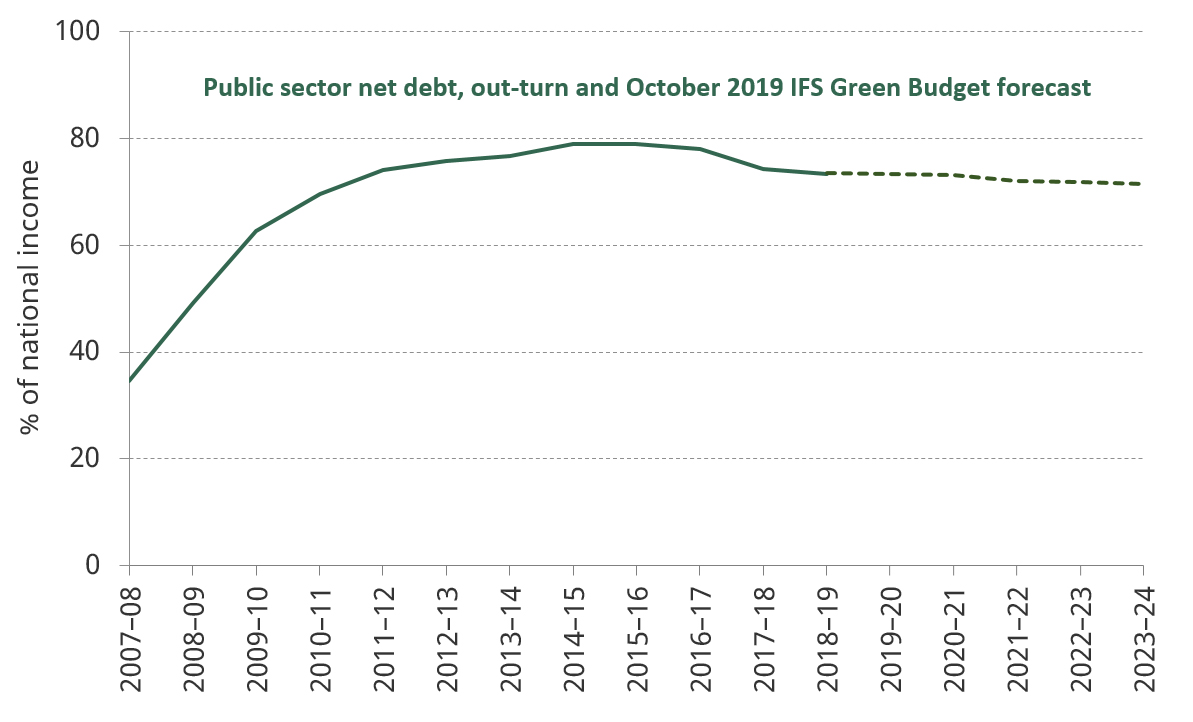
Source: Chart 4.8 of OBR, Economic and Fiscal Outlook: March 2019, https://obr.uk/efo/economic-fiscal-outlook-march-2019/. Forecasts from Table 4.2 of Emmerson, C. and Stockton, I. ‘Public finances: where are we now?’ in C. Emmerson, C. Farquharson and P. Johnson (eds), The IFS Green Budget: October 2019. London: Institute for Fiscal Studies.
With interest rates very low (and the debt interest burden actually lower today than it was in 2007-08) then we may be in a position to cope with higher debt if it is accumulated as a result of effective investments which result in higher growth. However, debt cannot go on rise forever, and debt incurred simply to pay for current spending is not going to offer a return to future generations to cover the increased burden on them. Moreover, demographic pressures will increase debt further in the medium term unless taxes are increased or spending is cut to accommodate those pressures. Had the Budget gone ahead today then, as we wrote in the Green Budget, we would have been looking for any further permanent day-to-day spending increases to be covered by either cuts elsewhere or increases in tax. Moreover, given the Government’s desire to spend more we argued that this is not the time to be implementing substantial and permanent net tax cuts.
Over the coming weeks we will be assessing the extent to which the main political parties manifestos would be consistent with effective management of the public finances.